Learn how various investments offer incremental opportunities for potential returns while still mitigating market risks.
In uncertain markets, investors may be holding larger than usual amounts of cash. Incremental “step-ups” in risk can potentially enhance returns while still managing volatility.
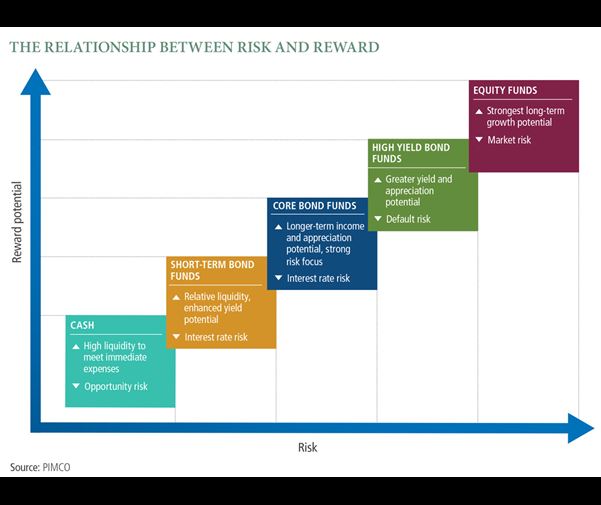
What this chart shows
Financial assets have unique risk/reward profiles. While cash carries the least risk, it also has the lowest return potential. Depending on their risk tolerance, investors can also look to bonds and equities for greater income or appreciation potential.
What it means for investors
No investment is truly risk free. While cash protects principal, its low returns may hinder you from reaching your financial objectives. You can step up your reward potential by prudently diversifying into riskier assets, which can help mitigate volatility while also keeping goals on course. However, it cannot assure a profit or protect against loss.
If you have questions and would like your financial situation to be evaluated, please email us on ds@bluerocke.com with your contacts, for an exploratory meeting, at our cost, not yours.
Learn the basics of bonds, including the concept of price.
The bond market is by far the largest securities market in the world, providing investors with virtually limitless investment options. Many investors are familiar with aspects of the market, but as the number of new products grows, even a bond expert is challenged to keep pace. Once viewed as a means of earning interest while preserving capital, bonds have evolved into a $100 trillion global marketplace that can offer many potential benefits to investment portfolios, including attractive returns.
Before tackling the complexities of this huge and diverse market, it is important to understand the basics: What is a bond and how can bonds help meet your investment goals?
What is a bond?
A bond is a loan that the bond purchaser, or bondholder, makes to the bond issuer. Governments, corporations and stat e governments issue bonds when they need capital. An investor who buys a government bond is lending the government money. If an investor buys a corporate bond, the investor is lending the corporation money. Like a loan, a bond pays interest periodically and repays the principal at a stated time, known as maturity.
Suppose a corporation wants to build a new manufacturing plant for $1 million and decides to issue a bond offering to help pay for the plant. The corporation might decide to sell 1,000 bonds to investors for $1,000 each. In this case, the “face value” of each bond is $1,000. The corporation – now referred to as the bond issuer − determines an annual interest rate, known as the coupon, and a timeframe within which it will repay the principal, or the $1 million. To set the coupon, the issuer takes into account the prevailing interest- rate environment to ensure that the coupon is competitive with those on comparable bonds and attractive to investors. The issuer may decide to sell five-year bonds with an annual coupon of 5%. At the end of five years, the bond reaches maturity and the corporation repays the $1,000 face value to each bondholder.
Every bond also carries some risk that the issuer will “default,” or fail to fully repay the loan. Independent credit rating services assess the default risk, or credit risk, of bond issuers and publish credit ratings that not only help investors evaluate risk but also help determine the interest rates on individual bonds. An issuer with a high credit rating will pay a lower interest rate than one with a low credit rating.
Again, investors who purchase bonds with low credit ratings can potentially earn higher returns, but they must bear the additional risk of default by the bond issuer.
What determines the price of a bond in the open market?
Bonds can be bought and sold in the “secondary market” after they are issued. While some bonds are traded publicly through exchanges, most trade over the counter between large broker-dealers acting on their clients’ or their own behalf.
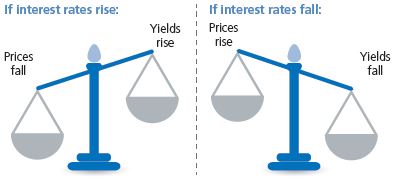
A bond’s price and yield determine its value in the secondary market. Obviously, a bond must have a price at which it can be bought and sold, and a bond’s yield is the actual annual return an investor can expect if the bond is held to maturity. Yield is therefore based on the purchase price of the bond as well as the coupon.
A bond’s price always moves in the opposite direction of its yield, as illustrated above. The key to understanding this critical feature of the bond market is to recognise that a bond’s price reflects the value of the income that it provides through its regular coupon interest payments. When prevailing interest rates fall – notably rates on government bonds – older bonds of all types become more valuable because they were sold in a higher interest- rate environment and therefore have higher coupons. Investors holding older bonds can charge a “premium” to sell them in the secondary market. On the other hand, if interest rates rise, older bonds may become less valuable because their coupons are relatively low, and older bonds therefore trade at a “discount.”
If you have questions and would like your financial situation to be evaluated, please email us on ds@bluerocke.com with your contacts, for an exploratory meeting, at our cost, not yours.
Learn the basics of bonds, including the concept of duration.
Duration, the most commonly used measure of bond risk, quantifies the effect of changes in interest rates on the price of a bond or bond portfolio.
The longer the duration, the more sensitive the bond or portfolio is likely to be to changes in interest rates.
What is Duration?
Duration is the most commonly used measure of risk in bond investing. Duration incorporates a bond’s yield, coupon, maturity and call features into one number, expressed in years, that indicates how price-sensitive a bond or portfolio is to changes in interest rates.
There are a number of ways to calculate duration, but the term generally refers to effective duration, defined as the approximate percentage change in price for a 100 basis point change in yield. For example, the price of a bond with an effective duration of two years will rise (fall) 2 per cent for every 1 per cent decrease (increase) in yield, and the price of a five-year duration bond will rise (fall) 5 per cent for a 1 per cent decrease (increase) in rates. The longer the duration, the more sensitive a bond is to changes in interest rates.
Different Duration Measures
Other methods of calculating duration are applicable in different situations, which we use to enhance our understanding of how bond portfolios will react in different interest-rate scenarios:
Curve Duration: this measures a portfolio’s price sensitivity to changes in the shape of the yield curve (that is, a steepening or flattening).
A portfolio’s curve duration is considered positive if it has more exposure to the 2- to 10-year part of the curve.
A portfolio with positive curve duration will perform well as the yield curve steepens, but will perform poorly as the yield curve flattens. A portfolio with negative curve duration has greater exposure to the 10- to 30-year portion of the curve. It will be a poor performer as the yield curve steepens and a strong performer as the yield curve flattens.
Spread Duration: this estimates the price sensitivity of a specific sector or asset class to a 100 basis-point movement (either widening or narrowing) in its spread relative to government bonds.
Total Curve Duration: this indicates a portfolio’s price sensitivity to changes in the shape of the yield curve relative to its benchmark’s sensitivity to those same changes (see Curve Duration above for characteristics of positive vs. negative portfolios).
The Uses of Duration Tools
Duration can be used in response to expected changes in the economic environment. If the outlook on bonds is bullish (that is, interest rates are expected to fall), duration is then extended. If the outlook on bonds is bearish, interest rates are expected to rise and duration is then reduced.
Fund managers also use duration in an attempt to construct the most appropriate portfolio for a given investor. They may choose to create:
Low-duration portfolios, which maintain average portfolio duration of one-to three-years, should be less volatile than longer-duration strategies which are often used as an alternative for traditional cash vehicles such as money market funds. In a low interest-rate environment, a low-duration portfolio can be a higher yielding alternative to money market funds to investors willing to accept additional risk in pursuit of greater return.
Moderate-duration portfolios, which maintain average portfolio durations ranging from two-to five-years, could be appropriate for investors seeking higher returns than those offered by money market or short-term investments, but who are averse to a higher level of interest rate risk as measured by duration.
Long-duration portfolios, which maintain average portfolio durations ranging from six to 25 years, offer a relatively stable alternative to equities. They may be suitable for an investor looking for a closer match between the duration of their portfolio and their liabilities. Longer- duration strategies tend to benefit from uncertainty in the financial markets that might result in, for example, equity- market volatility or a flight to quality assets such as high quality government bonds.
Equal Duration Does Not Mean Equal Returns
Although duration is an important tool in constructing portfolios, portfolios with the same duration don’t necessarily provide equal returns.
For example, a hypothetical portfolio of 10-year government bonds returned 15.4 per cent from October 2000 to October 2001. During the same period, a portfolio of two-year and 30-year government bonds with the same duration as the portfolio of 10-year government bonds produced a return of 11.8 per cent (a difference of 360 basis points).
Why did the two hypothetical portfolios with equal duration have such different returns? Because yields on government bonds of different maturities rarely move in unison. In general, the yield curve tends to steepen when interest rates are declining and flatten as interest rates rise.
In the example above, the yield on the 10-year government bonds dropped from 5.80 per cent to 4.59 per cent from October 2000 to October 2001, a 121-basis-point decline. The portfolio consisting of two-year and 30-year government bonds was affected by the significant steepening of the yield curve over the period in question. The 30-year bond went from yielding 14 basis points less than the two-year note in October 2000 to yielding 265 basis points more in October 2001, a 279-basis- point steepening.
If you have questions and would like your financial situation to be evaluated, please email us on ds@bluerocke.com with your contacts, for an exploratory meeting, at our cost, not yours.
Learn the basics of benchmarks, including the crucial role a benchmark serves in investing.
There are many different fixed interest indexes that can be used as benchmarks for a fixed- interest portfolio.
Choosing the right benchmark for a portfolio is important because the benchmark establishes the risk and return parameters for managing the portfolio.
The right benchmark for a given portfolio will depend on the investor’s goals for the portfolio, including the required return, the level of short-term and longer-term risk the investor is willing to assume, and other performance characteristics and requirements, including liquidity.
At a glance
A benchmark serves a crucial role in investing. Often a market index, a benchmark provides a starting point for a portfolio manager to construct a portfolio and directs how that portfolio should be managed on an ongoing basis from the perspectives of both risk and return. It also allows investors to gauge the relative performance of their portfolios; an annual return of 6% on a diversified bond portfolio may seem strong, but if the portfolio’s benchmark returns 7% over the same time period, the bond portfolio has fallen short of its goal.
The number of benchmarks is virtually endless, and selecting the right one is not always easy. To try to simplify the selection process, we examine:
What is a benchmark?
How is a benchmark calculated? and
How and why might a portfolio’s performance differ from its benchmark?
In Benchmarks:Selectinga Benchmark, we also look at the factors to consider when trying to find the best benchmark for an investment portfolio.
What is a Benchmark?
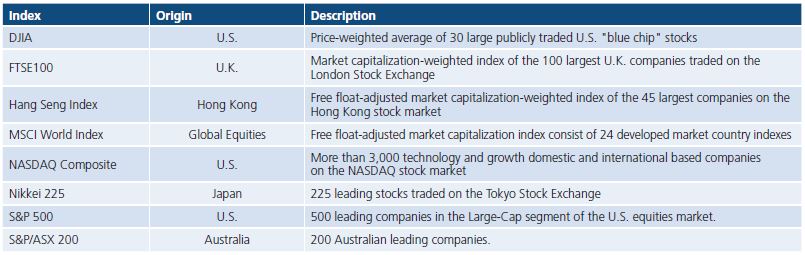
In most cases, investors choose a market index, or combination of indexes, to serve as the portfolio benchmark. An index tracks the performance of a broad asset class, such as all listed stocks, or a narrower slice of the market, such as technology company stocks. Because indexes track returns on a buy-and-hold basis and make no attempt to determine which securities are the most attractive, they represent a “passive” investment approach and can provide a good benchmark against which to compare the performance of a portfolio that is actively managed. Using an index, it is possible to see how much value an active manager adds and where – that is, through which investments – that value is added.
The following are among the most widely followed share indexes, or benchmarks:
Numerous other equity indexes have been designed to track the performance of various market sectors and segments. Because shares trade on open exchanges and prices are public, the major indexes are maintained by publishing companies like Dow Jones and the Financial Times, or the stock exchanges.
Fixed income securities do not typically trade on open exchanges, and bond prices are therefore less transparent. As a result, the most commonly used fixed income indexes are those created by large broker-dealers that buy and sell bonds, including Barclays Capital (which now also manages the indexes originally created by Lehman Brothers), Citigroup, J.P. Morgan, and BofA Merrill Lynch. Widely known indexes include the Barclays Global Aggregate Bond Index, tracking the largest global bond issuers. The Bloomberg AusBond Composite 0+ Yr Index, is the most widely used Australian fixed interest benchmark.
If you have questions and would like your financial situation to be evaluated, please email us on ds@bluerocke.com with your contacts, for an exploratory meeting, at our cost, not yours.